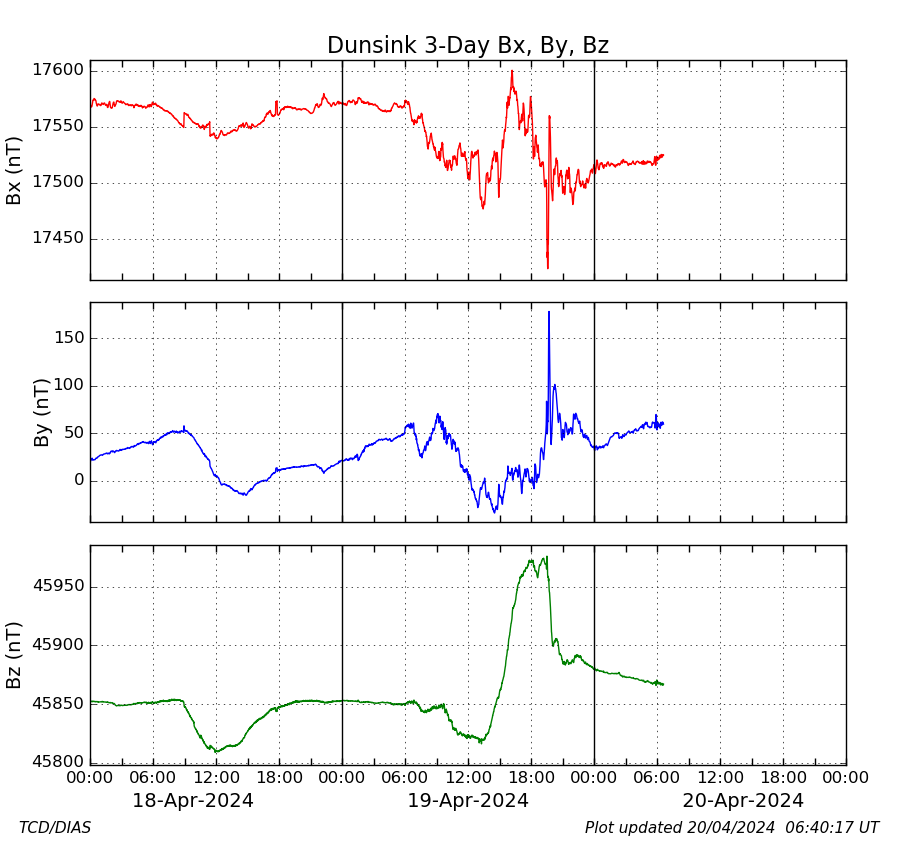
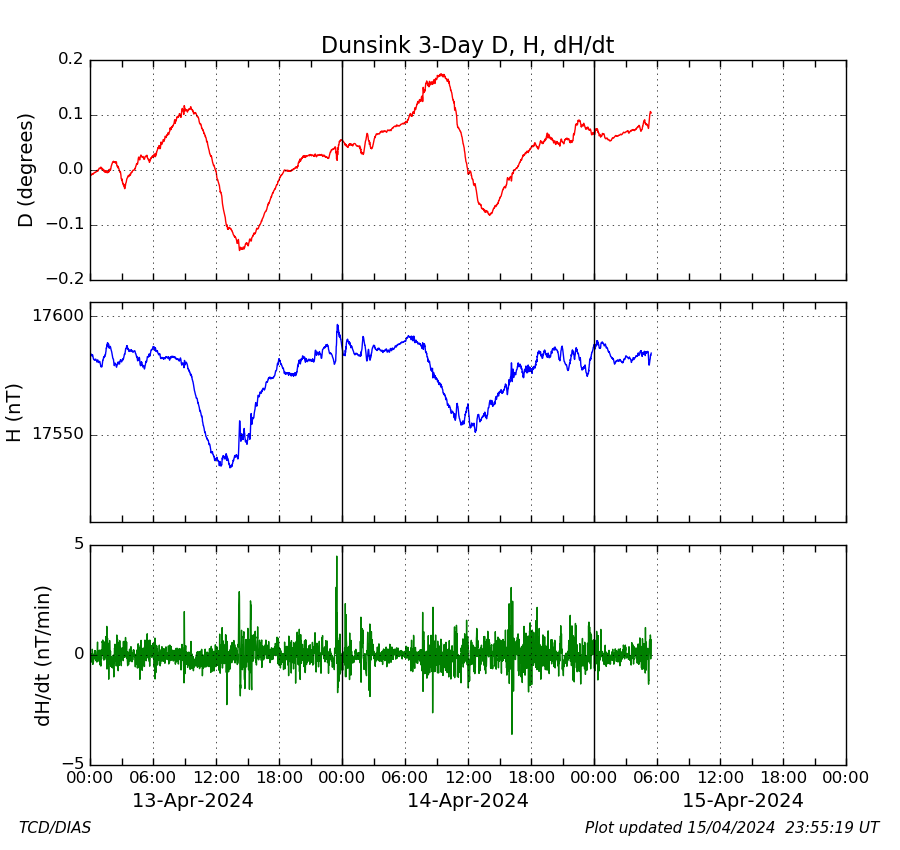
Above are plotted near-realtime magnetic field data from the DIAS/TCD/Met Eireann magnetometer network. Plots are updated every 5 minutes. A local K-index for each site is also given below, which gives a measure of the disturbance of the geomagnetic field, and may be an indicator of auroral activity. The K-indices are calculated using the FMI method. Please visit the data archives to download plots and text data files. If you intend to use the data for scientific purposes, please acknowledge "the Magnetometer Network of Ireland and the Dublin Institute for Advanced Studies".
Above are plotted near-realtime magnetic field data from the DIAS/TCD/Met Eireann magnetometer network. Plots are updated once every 5 minutes. A local K-index for each site is also given below, which gives a measure of the disturbance of the geomagnetic field, and may be an indicator of auroral activity. The K-indices are calculated using the FMI method. Please visit the data archives to download plots and text data files. If you intend to use the data for scientific purposes, please acknowledge "the Magnetometer Network of Ireland and the Dublin Institute for Advanced Studies".


